Free English Track Level D Sheet 15 | Year 4 | BookFlik
Welcome to your child’s final challenge in our current unit. Maths Track Level D Sheet 15 — Line graphs: read and interpret a temperature line graph is designed to help your Year 4 learner master the art of tracking data over time. In this activity, Nova the barn owl guides children through a weather investigation, helping them plot and read points on a graph to see how temperatures shift throughout a day.
This sheet is the culmination of our unit on data handling. Having already mastered bar charts and pictograms, your child is now ready to understand how line graphs show continuous change. Maths Track Level D Sheet 15 — Line graphs: read and interpret a temperature line graph acts as a bridge to more complex scientific reporting, ensuring they can identify trends and make predictions based on visual data.
By completing this sheet, your child will confidently read axes, identify specific temperature points, and explain why a line might go up or down. They will develop the analytical skills needed to interpret real-world information, such as weather forecasts. We are so proud of the progress your child has made throughout this series, and this final task is a brilliant way to celebrate their growing mathematical confidence.
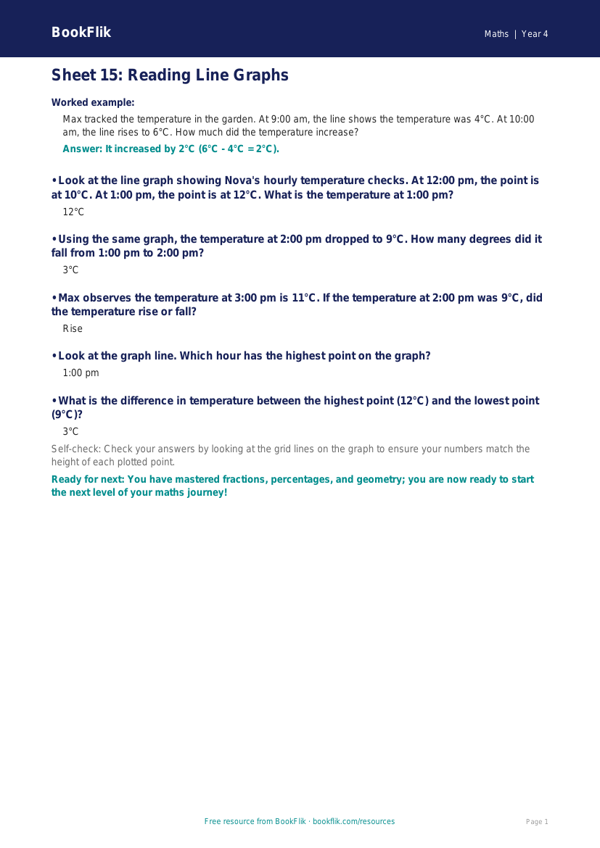
Preview the worksheet
If the preview does not load, open the PDF in a new tab.