
Free Statistics Activity Sheet | Grade 3 | Math | BookFlik
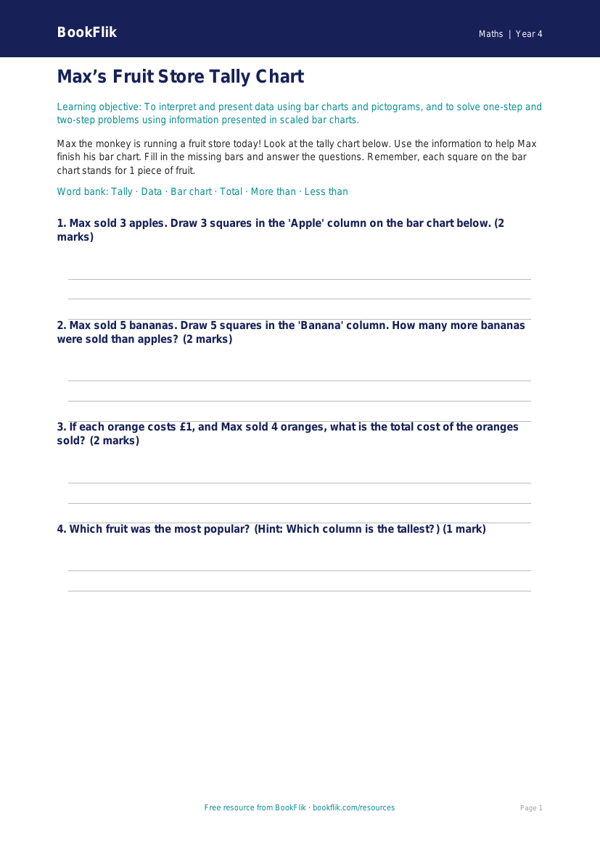
Are you looking for a fun way to help your pupils master data handling? Our new Math statistics activity sheet year 4 supported is designed to help children build confidence in reading and interpreting bar charts and pictograms. This resource is perfect for learners who need a little extra help, providing clear scaffolding and simple steps to follow.
In this lesson, Max the monkey has been busy counting the fruit he collected for his friends. Pupils will use his findings to answer questions about different groups of data. By completing this Math statistics activity sheet year 4 supported, children will learn how to read scales on a bar chart, identify the most and least popular items, and solve simple addition and subtraction problems based on the numbers shown.
This worksheet is fully aligned with the Common Core State Standards for Grade 3, which requires pupils to interpret and present discrete and continuous data using appropriate graphical methods. We have specifically designed this resource as a Math statistics activity sheet year 4 supported to ensure that SEN and emerging learners can access the curriculum alongside their peers. Each question includes helpful sentence starters and a visual word bank to support vocabulary acquisition and mathematical reasoning.
Teachers can use this resource as a focused small-group activity, a guided intervention, or as an independent task for children who need extra structure. With clear answer frames and short, manageable tasks, pupils will feel a sense of achievement as they work through the problems.
Download this free resource today to provide your Grade 3 students with the extra support they need to succeed in math.
Word Bank:
Bar chart
Total
More than
Less than
Difference
Scale
Data
Preview the worksheet
If the preview does not load, open the PDF in a new tab.